This is a more-or-less transcript of a talk I recently gave at our /dev/øl conference at RiksTV.
The context was to talk a bit about some of the great features of Prometheus, and hopefully persuade my colleagues that we should move away from Datadog.

Prometheus is an open-source monitoring system that gathers metrics from targets, stores the data in its database, and makes that data available for visualisation and statistical operations. At RiksTV we currently use Datadog, but I prefer Prometheus because it has better statistics, better exporters, and more flexibility. And because it’s open source there’s no license fee so we’d be able to install it in test as well as prod - right now we have no monitoring in the dev account, and I worry that we miss some insights and warning by not seeing any alerts before we deploy to production.
Background
The folks at Google created some nice tooling, Borg for cluster scheduling and Borgmon to monitor Borg. When people from Google moved on, they recreated Borg and Borgmon as Kubernetes and Prometheus. Prometheus was written at SoundCloud, but both Kubernetes and Prometheus have now been donated to the Cloud Native Foundation.
Architecture
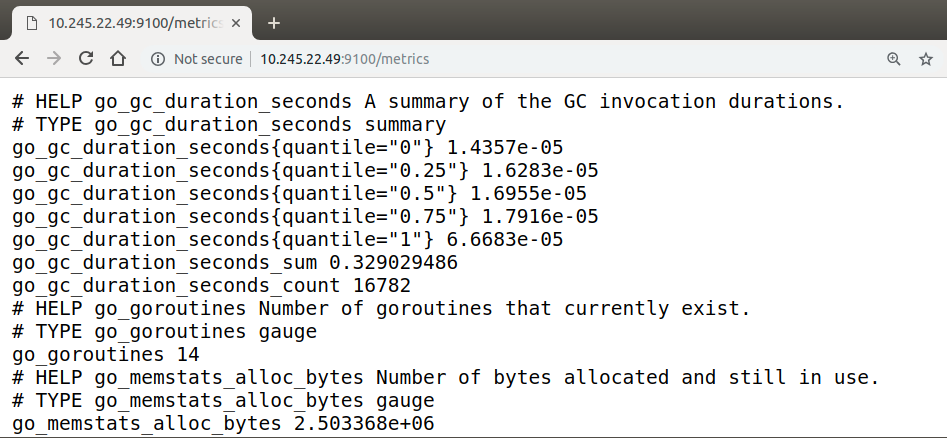
The basic architecture is that each target exposes its metrics at a http /metrics endpoint, and Prometheus scrapes the target endpoints, storing the data in its database.
Exporters
Something I really like about Prometheus is the exporters. There’s a huge amount available already, plus it’s really easy to write your own. There’s also the pushgateway, where instances that are too ephemeral to be scraped can send their data.
Data model
The underlying data model Prometheus uses is a timeseries, that is, whatever data you collect, time will be one of the two dimensions. Time is always represented on the x-axis of our graphs. There are a few basic data types that Prometheus collects:
-
Counter: a number that can only go up, eg number_dns_lookups 547
-
Gauge: a number that can go up or down, eg memory_free 1.54e+08
-
Histogram: observations sampled in buckets, eg request_duration{le=”0.1”} 8
-
Summary : quartiles, sum and count, eg request_duration{quantile=”0.5”} 216
The data we are presented with in Prometheus is in this shape:
http_requests_total {code="200", method="get" } 3
http_requests_total {code="200", method="post" } 6
http_requests_total {code="304", method="get" } 1
http_requests_total {code="400", method="get" } 3
http_requests_total {code="404", method="get" } 4
That is, the name of the metric, and a set of key/value labels that we can use to filter the data. Filtering supports both string and regex expressions, for example, get all 400s like:
http_requests_total{code="400"}
and get all 40X errors like
http_requests_total{code=~"4.*"}
These data sets are all instant vectors, but if we want to look at data over a bigger time window we can start to use functions like:
rate(http_requests_total[5m])
to get the rate of requests per second, averaged for the last 5 minutes. Looking at bigger timeframes lets us smooth out spkey data and alert on trends rather than individual events.
Query language
Promtheus has a rich library of operators and functions so we can start to build up queries to answer specific questions we might have about our systems.
Is my Consul cluster losing nodes?
((sum(node_healthy) by (datacenter)) / (sum(node_healthy OFFSET 1h) by (datacenter))) < 0.5
We compare the total number of healthy nodes in Consul right now with how many healthy nodes there were an hour ago. If we have less that half than we used to have, something is probably going badly wrong.
How much RAM am I using, and what will I alert on?
We can build up a query in a few steps from the metrics available:
-
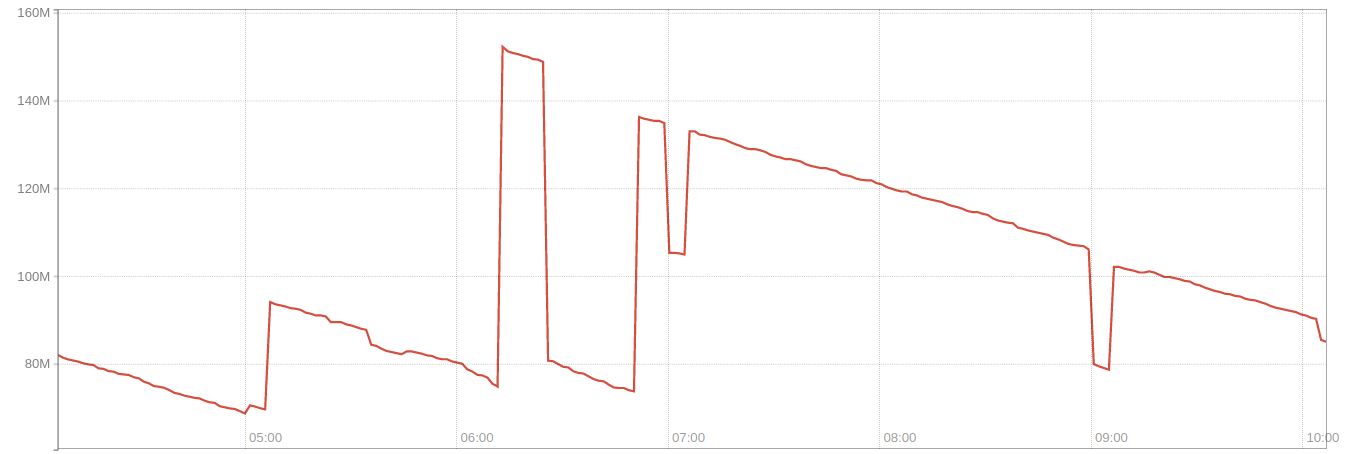
Let’s start with looking at
node_memory_MemFree
-
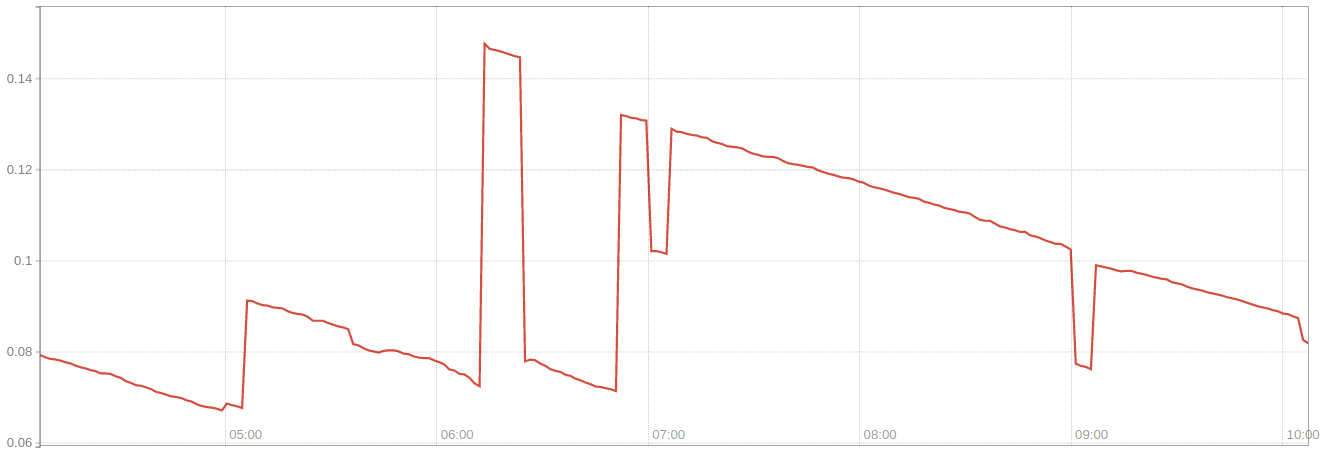
That’s an absolute number, but more useful would be to see that as a ratio of
node_memory_MemFree/node_memory_MemTotal
-
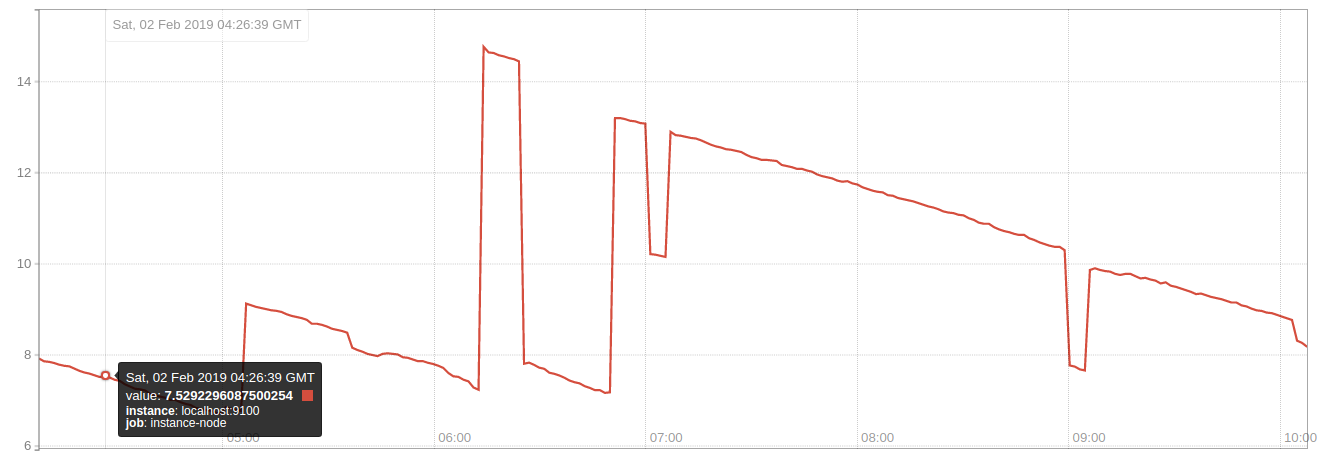
Now to get that as a percent we do
(node_memory_MemFree/node_memory_MemTotal)*100
-
And to see how much memory we’re using, we do
100-((node_memory_MemFree/node_memory_MemTotal)*100)
-
If we decide to alert when the amount of memory used goes above 90%, we can see when that will happen doing
100-((node_memory_MemFree/node_memory_MemTotal)*100) > 90
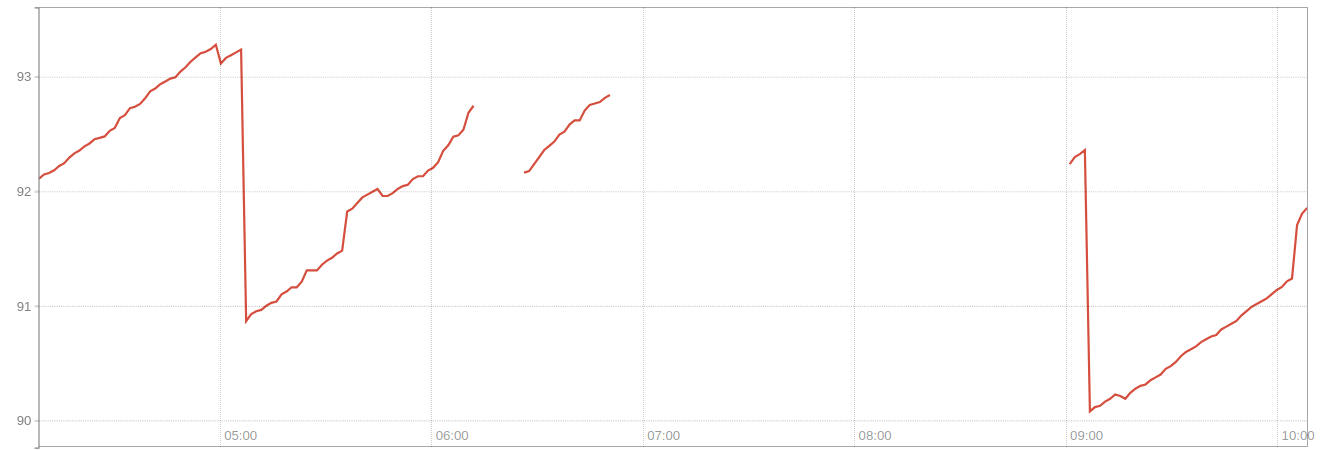
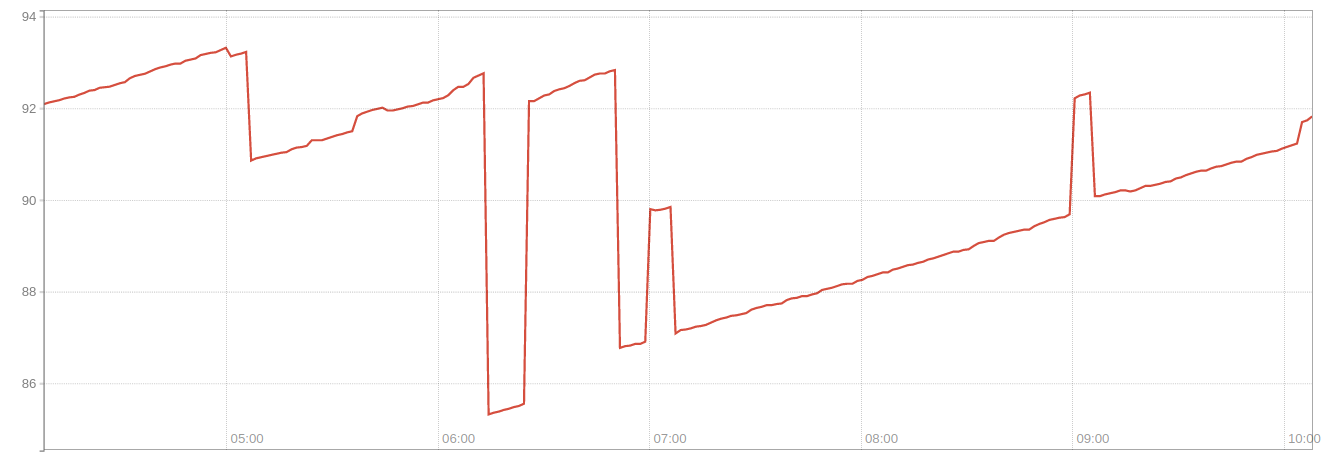
Will we run out of disk space in the next 24h?
predict_linear(node_filesystem_avail [6h], 24*60*60) <1
Looking at the trend in available disk space over the last 6h, we predict how much will be available in 24h. If this line crosses zero, we alert.
Alerting
Making one of these queries into an alert is super easy, we just add it into the prometheus/alerts.yml file with a bit of formatting:
alert: Disk_full_24h
expr: predict_linear(node_filesystem_avail[6h], 24 * 60 * 60) < 1
for: 2h
labels:
  severity: critical
  summary: Partition  on  will be full within 1 day
Prometheus’s default action if one of these alerts is triggered is to show a red bar instead of a green bar for the alert in the browser, which isn’t so alerty, but the good news is that the alertmanager addon is very simple to install and propagates your alerts to OpsGenie, PagerDuty, Slack or whereever so that you get woken up when your stuff pops.
Grafana
Prometheus also integrates really nicely into Grafana, so you can gather your graphs together and make pretty dashboards.

Wrapping up
By now you’ve probably realised I’m a huge data nerd and that I think Prometheus is fantastic for monitoring. For me, the best bit is the instant feedback loop of developing queries to filter and alert on metrics. My demo Prometheus / AlertManager / NodeExporter / Grafana took me about 15 minutes to move to AWS after my laptop threatened to die yesterday, which tells you a bit about how easy it is to set up. Hopefully I’ve convinced some of you to have a go with this great tool.
References
https://github.com/prometheus
https://www.robustperception.io/blog
https://runnable.com/blog/how-we-saved-98-on-infrastructure-monitoring-costs
http://www.digitaldigging.net/prometheus-an-archaeological-perspective/
http://tylervigen.com/spurious-correlations
https://github.com/infinityworks/prometheus-example-queries
https://timber.io/blog/promql-for-humans/